Jittering in R (ggplot2)
Jittering is the act of adding random noise to data in order to prevent overplotting in statistical graphs. Overplotting can occur when a continuous measurement is rounded to a convenient unit. This has the effect of making a continuous variable appear like a discrete ordinal variable.
For example, age is measured in years and body weight is measured in pounds or kilograms.
A scatter plot of weight versus age, which includes a sufficiently large sample of people will involve considerable overlap. Many individuals may be recorded as, 29 years old and weighing 70 kg, and there will be many markers plotted at the point (29, 70). The same is often true when plotting other individual difference metrics throughout psychology (e.g. personality) (Figure 1).

To alleviate overplotting, it is possible to add a small amount of random noise to the data (Figure 2). The size of the noise is often chosen to be the width of the measurement unit.
Example Code using position_jitter via ggplot2:
library(ggplot2)
ggplot(data, aes(x=x, y=y)) +
geom_point(position=position_jitter(width=0.1), size = 3) +
ylab("y") +
xlab("x") +
theme_classic()
For example, age is measured in years and body weight is measured in pounds or kilograms.
A scatter plot of weight versus age, which includes a sufficiently large sample of people will involve considerable overlap. Many individuals may be recorded as, 29 years old and weighing 70 kg, and there will be many markers plotted at the point (29, 70). The same is often true when plotting other individual difference metrics throughout psychology (e.g. personality) (Figure 1).
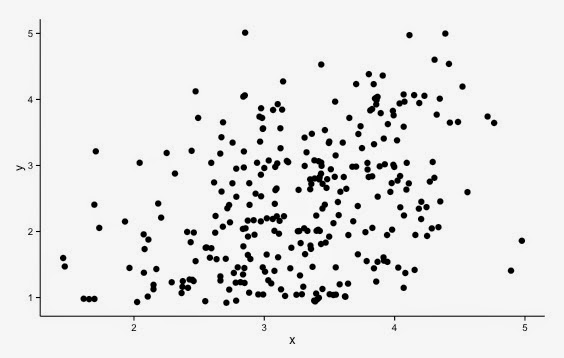
Figure 1: Before Jittering - a significant positive correlation between x & y [r = .37].
To alleviate overplotting, it is possible to add a small amount of random noise to the data (Figure 2). The size of the noise is often chosen to be the width of the measurement unit.
Figure 2: The same data with a small level of jittering applied.
For example, to the value 70 kg you might add the quantity u, where u is a uniform random variable in the interval [-0.5, 0.5]. This is based on the assumption that the true weight of a 70 kg person is equally likely to be anywhere in the interval [69.5, 70.5]. The original value (70kg) is, however, retained for any additional inferential statistical analysis. In addition, because the noise generated is random, executing the same code repeatedly will result in a slightly different layout for every render.
Finally, the context of the data is important when deciding how to jitter. Too much noise and any relationship can be obscured or exaggerated. There are other reasons that markers are overplotted in scatter plots, including having many thousands of data points. Jittering does not always prevent this kind of overplotting, and adjusting the level of transparency may be more suitable in some instances.
library(ggplot2)
ggplot(data, aes(x=x, y=y)) +
geom_point(position=position_jitter(width=0.1), size = 3) +
ylab("y") +
xlab("x") +
theme_classic()
Comments
Post a Comment